8/12/2021
1Spatial’s mobile application to capture real world data for land inspection programme
Contributed by 1Spatial
29/04/2021 - 1Spatial

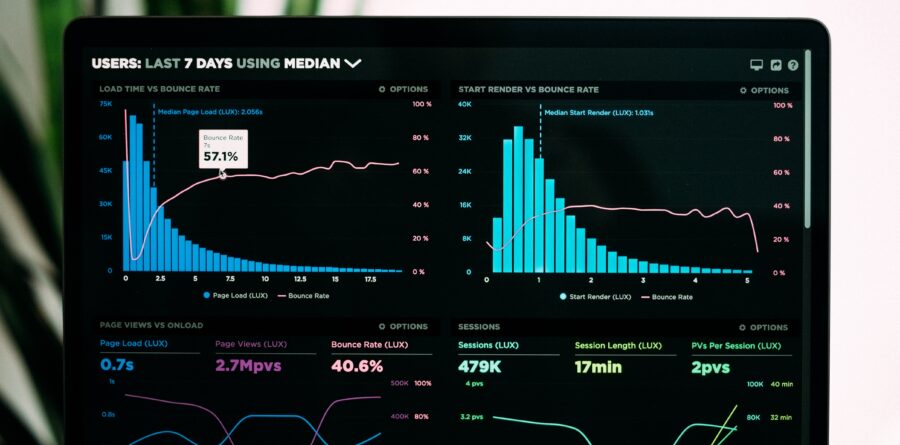
Data Analytics are crucial to helping organisations respond to change, navigate uncertainty, and identify opportunities. As recognized by Gartner in technology trends for 2021, Data and Analytics are increasingly being seen as a core business function and implementing a dashboarding tool is often seen as a “quick win” for improving analytics.
Dashboarding is a key method of efficiently analysing your data, displaying metrics and trends at a glance. They enable you to improve your decision making, revealing insight into Key Performance Indicators (KPIs) and other metrics via intuitive visualisations.
In fact, dashboarding and infographics have become so commonplace, we see them in all areas of daily life – from productivity tooling in the workplace such as JIRA, to collating personal data from fitness and wearables technology like Fitbit and Strava. In a data driven world, we have grown to expect simple and effective data visualisation in all areas of our lives.
1Data Gateway includes its own intuitive Dashboard out-of-the-box, and the latest release adds API functionality so it can easily be connected to an external dashboard.
There are a variety of tools on the market to meet this growing need for customisable data dashboarding, 1Spatial have provided a step by step guide on how you can quickly and easily connect 1Data Gateway to Microsoft’s Power BI.
1Spatial unlock the value of location data by bringing together people, innovative solutions, industry knowledge and our extensive customer base visit the 1Spatial website for more information
All articles on this news site are submitted by registered contributors of EssexWire. Find out how to subscribe and submit your stories here »